
Diagram it, Jarvis — Understanding C4 Model and Structurizr for effective software architecture visualization
Introduction
Think about all the times you’ve joined a new development or product team. How was your onboarding process? How did they introduce you to the way each part of the system works? What if there was a way to make all of this simpler? Imagine navigating your way using Google Maps, where you can zoom in and out at different levels — from country to state, city to street. The C4 Model works in a similar way, providing different levels of detail to help you understand a software system.
What is the C4?
The C4 Model is a framework for visualizing the architecture of software systems. Created by Simon Brown in 2011, it offers a standardized method to describe and communicate the architecture through a series of hierarchical diagrams. The name “C4” stands for the four types of diagrams used in the model: Context, Container, Component, and Code.
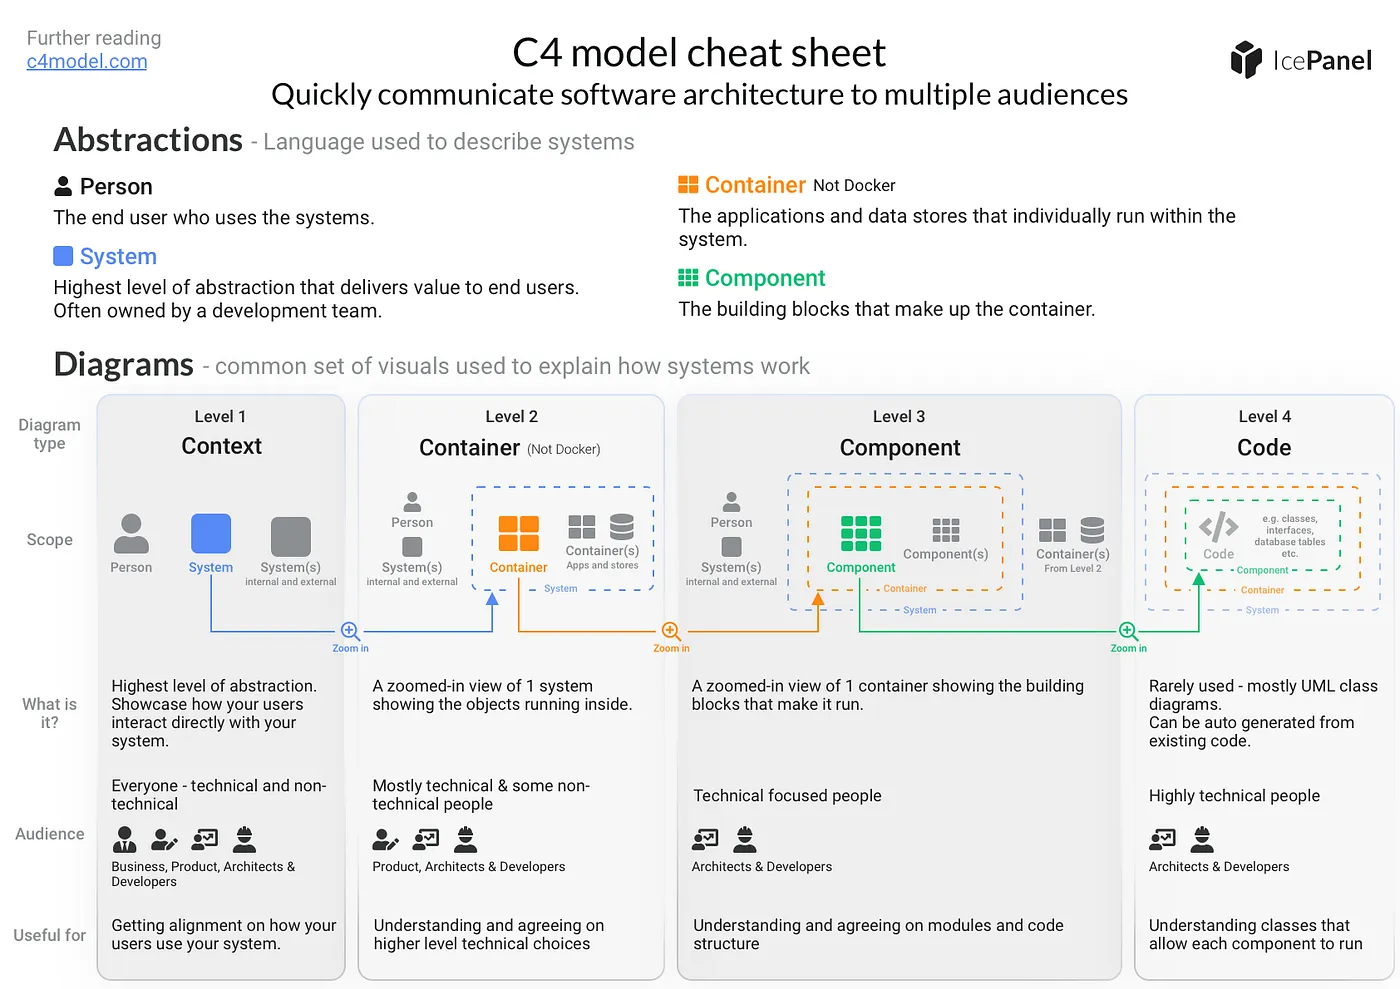
The Purpose of Each C4 Diagram
C1 — Context Diagram
The Context diagram provides a high-level overview of the system and its interactions with external entities such as users, external systems, and other stakeholders. It answers the question, “What is this system and who does it interact with?”
C2 — Container Diagram
The Container diagram zooms in on the system, illustrating the major containers (applications, databases, services) that make up the system and how they communicate with each other. It answers the question, “What are the major building blocks of this system?”
A good mantra here: container is not Docker, container is not Docker, container…
Always think of it as all the single pieces that are not deployed together (a java microservice, a database, a external API, etc.) and how they relate with each other.
C3 — Component Diagram
The Component diagram goes a level deeper, showing the internal structure of each container, including the components and their relationships. It answers the question, “What are the key components and how do they interact within a container?”
It’s pretty similar to a simplified class diagram from UML.
C4 — Code Diagram
The Code diagram, often omitted in practice, provides a detailed view of the implementation of a component (class). It answers the question, “How is this component implemented?”.
That’s why, with a good coding practices, this one shouldn’t be necessary.
Cheat Sheet

Benefits of the C4 Model
The C4 Model helps teams visualize the architecture of a system in a clear and structured manner, making it easier to communicate complex architectures to both technical and non-technical stakeholders. By using standardized diagrams, it ensures consistency and helps avoid misunderstandings.
The Concept of “Diagram as Code”
“Diagram as Code” is a concept that involves defining diagrams using textual descriptions instead of drawing them manually. This approach allows diagrams to be version-controlled, reviewed, and maintained alongside the codebase. It enhances collaboration and ensures that diagrams are always up-to-date with the system’s architecture.
Introducing Structurizr
Structurizr is a set of tools and services that support the C4 Model and the concept of Diagram as Code. Created by Simon Brown, Structurizr allows you to create, visualize, and share software architecture diagrams using a Domain-Specific Language (DSL). It integrates seamlessly with code repositories, enabling teams to manage architecture diagrams in a collaborative and version-controlled manner.
Structurizr in the 2024 Tech Radar
In April 2024, Structurizr was featured in the Thoughtworks Technology Radar (page 23), which highlighted its growing importance and utility in the industry. The Technology Radar is an opinionated guide to today’s technology landscape, created by the Thoughtworks Technology Advisory Board. This recognition underscores Structurizr’s value in providing a robust framework for visualizing software architectures, making it a recommended tool for enterprises seeking to improve their architecture documentation and collaboration practices.
Key Components of Structurizr DSL
The Structurizr DSL provides a simple and expressive syntax for defining software architecture diagrams. Here are some of the key components:
Workspace
The workspace defines the overall context for your diagrams. It includes the model and views for the system architecture.
workspace {
  model {
          user = person "User" "A user of the system"
          softwareSystem = softwareSystem "Software System" "A description of the system" {
              webApp = container "Web Application" "A web application" "Java and Spring Boot"
              database = container "Database" "Stores user data" "Relational Database"
          }
          user -> webApp "Uses"
          webApp -> database "Reads from and writes to"
      }
      views {
          systemContext softwareSystem {
              include user
              include softwareSystem
              autolayout lr
          }
          container softwareSystem {
              include webApp
              include database
              autolayout lr
          }
          theme default
      }
}
Model
The model section defines the entities and relationships in your system. This includes people, software systems, containers, components, and their interactions.
Views
The views section specifies how the model elements should be visualized. It includes definitions for the context, container, component, and code views.
Styles
The styles section allows you to customize the appearance of the elements in your diagrams. You can define colors, shapes, and other visual attributes to make your diagrams more readable and visually appealing.
styles {
    element "Person" {
        background "#08427b"
        color "#ffffff"
        shape "Person"
        border "Solid"
    }
    element "Software System" {
        background "#1168bd"
        color "#ffffff"
        shape "RoundedBox"
        border "Solid"
    }
    element "Container" {
        background "#438dd5"
        color "#ffffff"
        shape "RoundedBox"
        border "Dashed"
    }
    element "Database" {
        background "#facc2e"
        color "#000000"
        shape "Cylinder"
        border "Solid"
    }
}
Example: Creating Diagrams with ChatGPT
To get started with Structurizr and the C4 Model, you can use ChatGPT to help generate the initial DSL code.
Copy the script into Structurizr DSL page and ask it to render.

ChatGPT Prompt (use the text below as an example, put your own instead —and also try ChatGPT application audio record option as well):
Create a Structurizr DSL script to model a web-based e-commerce system.
The system should have a user interacting with a web application,
which communicates with an inventory service and a payment service.
The inventory service interacts with a product database, and the payment
service interacts with a payment gateway and an external fraud detection
service. Include context and container diagrams.

[put a Structurizr script as an example if you want more accuracity]
workspace {
model {
user = person "Customer" "A customer using the e-commerce platform" {
tags "Customer"
}
eComSystem = softwareSystem "E-Commerce System" "An online platform for buying and selling products" {
webApp = container "Web Application" "Allows customers to browse and purchase products" "React and Node.js" {
tags "Web"
}
inventoryService = container "Inventory Service" "Manages product inventory" "Java and Spring Boot"
paymentService = container "Payment Service" "Handles payment transactions" "Python and Flask"
productDatabase = container "Product Database" "Stores product information" "MongoDB" {
tags "Database"
}
paymentGateway = container "Payment Gateway" "Processes payment transactions" "Third-party service"
fraudDetectionService = container "Fraud Detection Service" "Detects fraudulent transactions" "Third-party service"
}
user -> webApp "Browses and purchases products"
webApp -> inventoryService "Fetches product details from"
webApp -> paymentService "Sends payment details to"
inventoryService -> productDatabase "Reads from and writes to"
paymentService -> paymentGateway "Processes payments through"
paymentService -> fraudDetectionService "Checks for fraud"
}
views {
systemContext eComSystem {
include user
include eComSystem
autolayout lr
}
container eComSystem {
include webApp
include inventoryService
include paymentService
include productDatabase
include paymentGateway
include fraudDetectionService
autolayout lr
}
styles {
element "Customer" {
background "#000000"
color "#ffffff"
shape "Person"
border "Solid"
}
element "Web" {
background "#438dd5"
color "#ffffff"
shape "WebBrowser"
border "Dashed"
}
element "Database" {
background "#facc2e"
color "#000000"
shape "Cylinder"
border "Solid"
}
}
theme default
}
}Conclusion
The C4 Model, combined with Structurizr, provides a powerful approach for visualizing and managing software architecture. By using the C4 Model’s hierarchical diagrams and Structurizr’s Diagram as Code capabilities, teams can ensure their architecture is well-documented, consistent, and easily understandable. Whether you are starting a new project or maintaining an existing system, leveraging these tools can significantly enhance your team’s ability to communicate and collaborate on software architecture.
Try out the provided prompt with ChatGPT to generate your own Structurizr DSL scripts and start visualizing your software architecture today.
